Tracing
Background
The query trace tool helps analyze and debug query performance and correctness issues. It helps prevent interference from external noise in a production environment (such as storage, network, etc.) by allowing replay of a part of the query plan and dataset in an isolated environment, such as a local machine. This is much more efficient for query performance analysis and issue debugging, as it eliminates the need to replay the whole query in a production environment.
How Tracing Tool Works
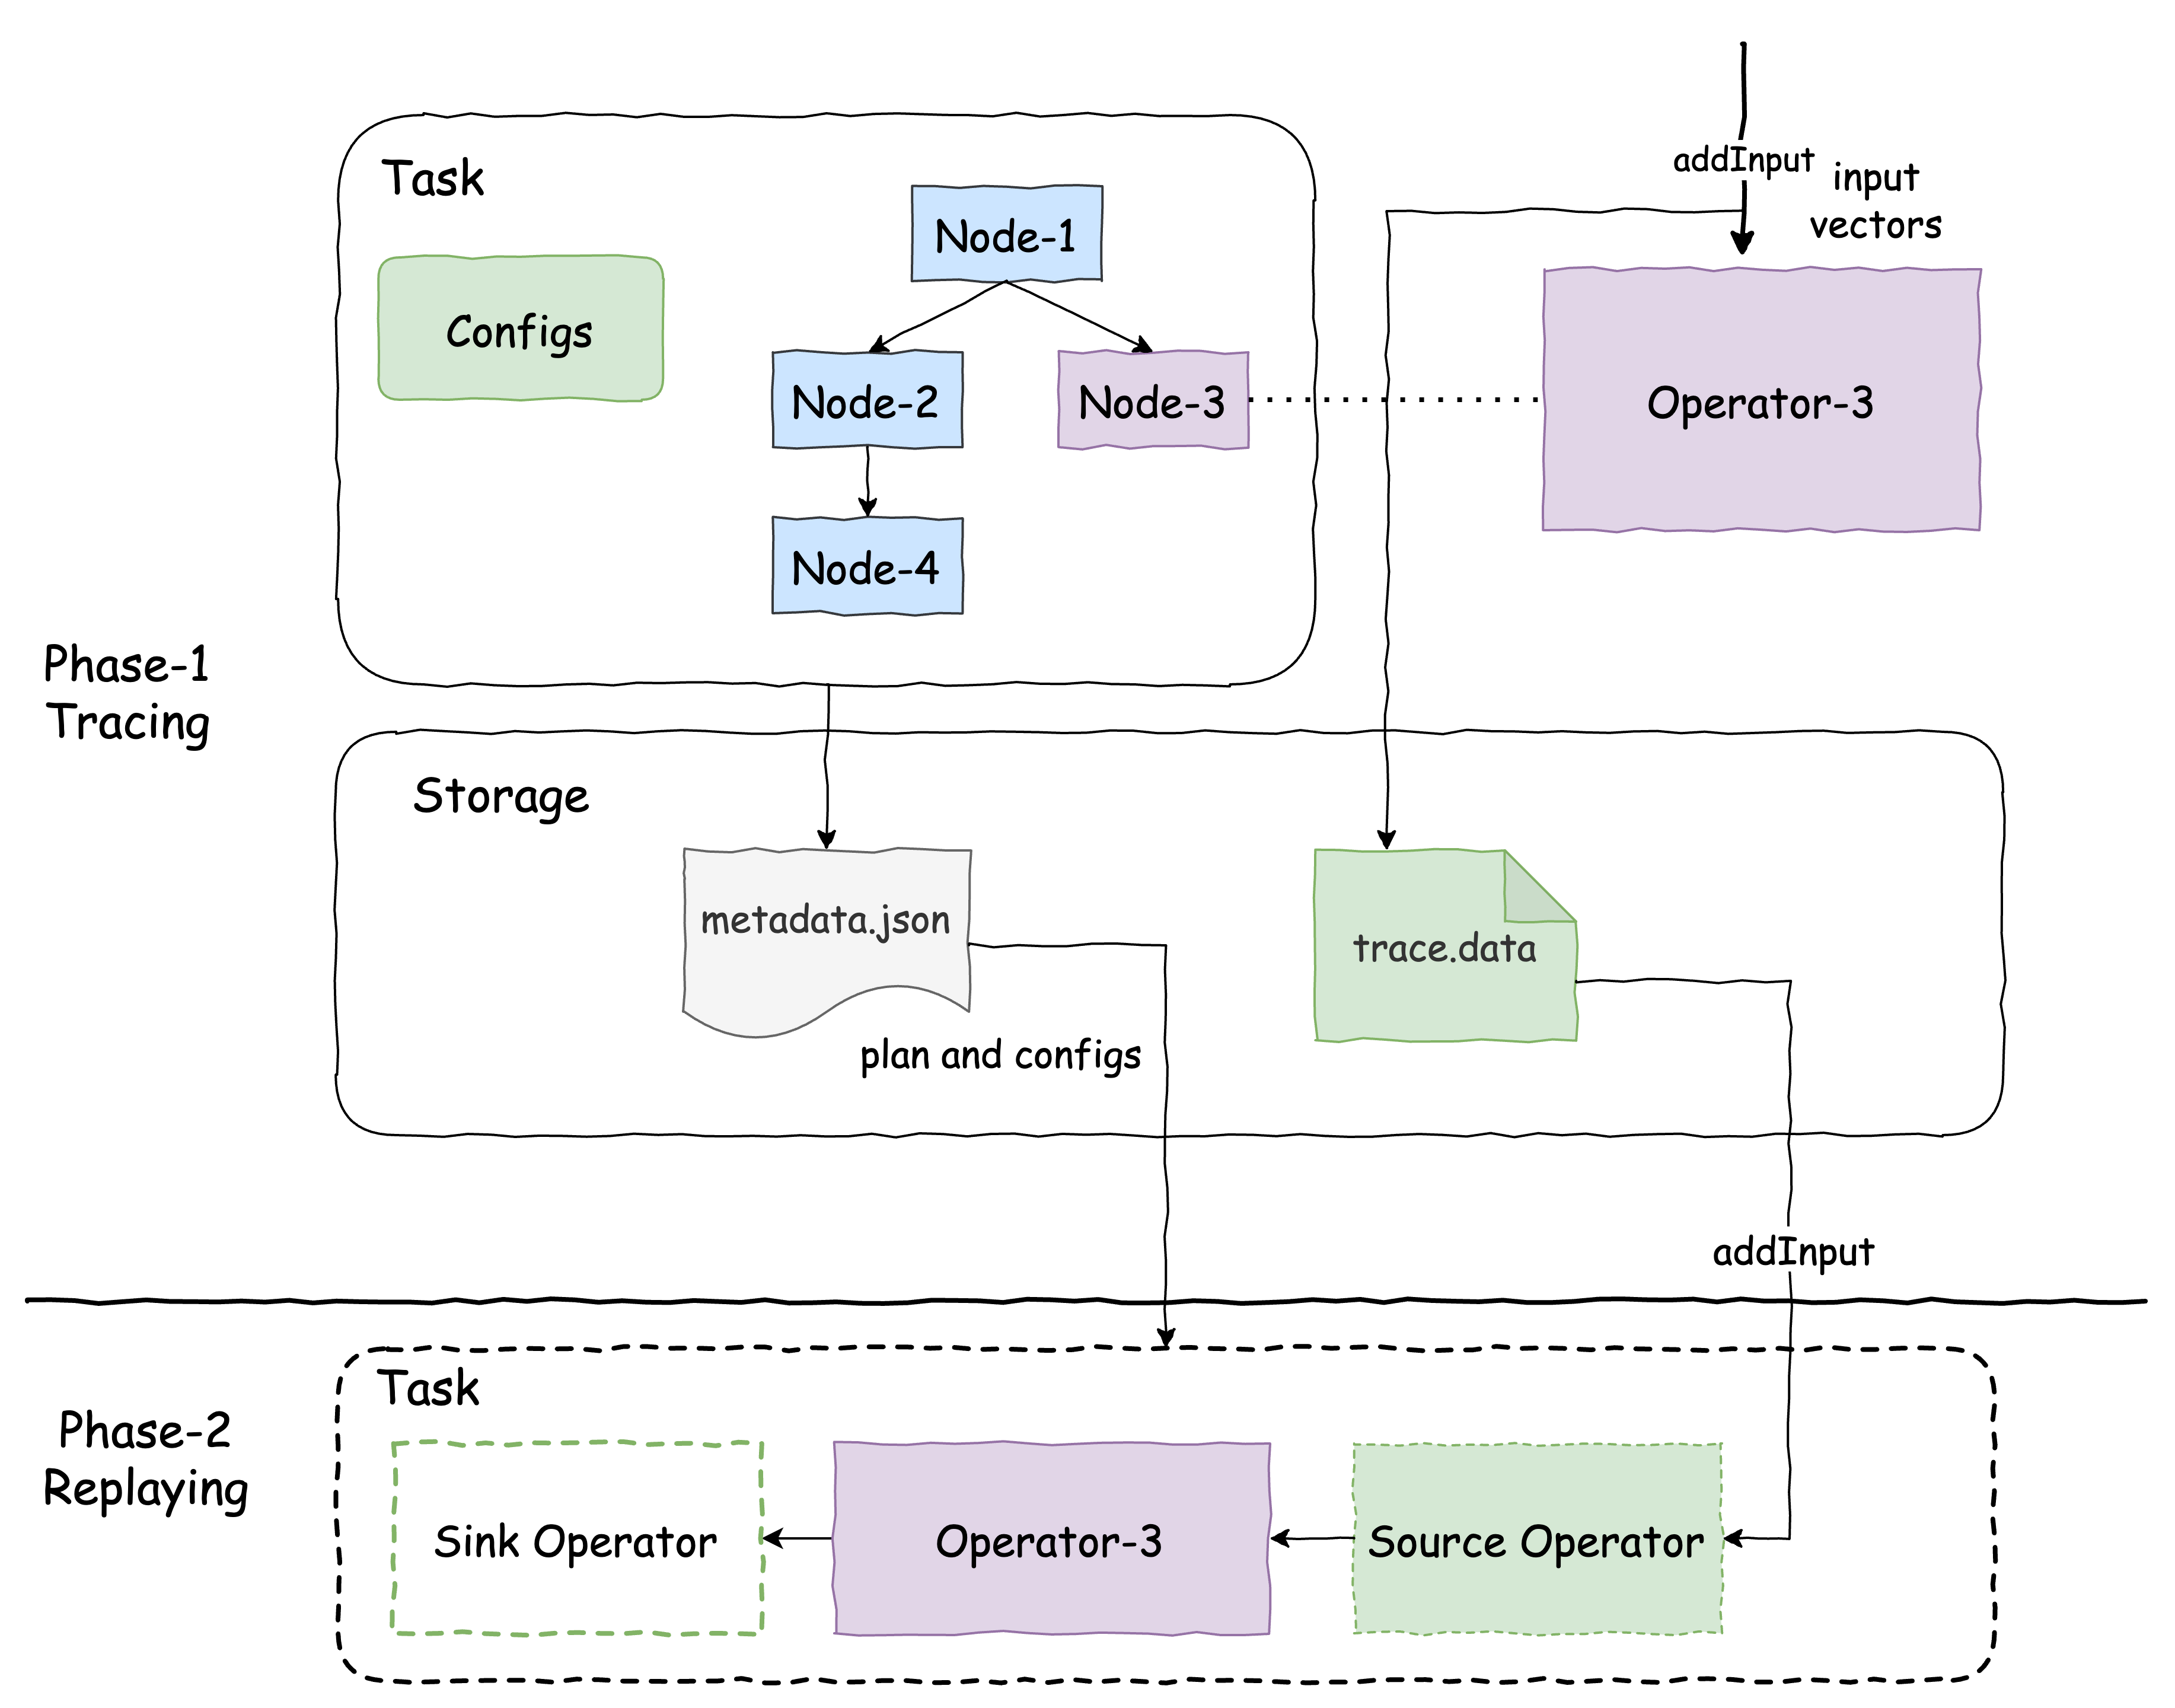
The tracing process consists of two distinct phases: the tracing phase and the replaying phase. The tracing phase is executed within a production environment, while the replaying phase is conducted in a local development environment.
Tracing Phase
Trace replay required metadata, including the query plan fragment, query configuration, and connector properties, is recorded during the query task initiation.
Throughout query processing, each traced operator logs the input vectors or splits storing them in a designated storage location.
The metadata and splits are serialized in JSON format, and the operator data inputs are serialized using a Presto serializer.
Replaying Phase
Read and deserialize the recorded query plan, extract the traced plan node, and assemble a plan fragment with customized source and sink nodes.
The source node reads the input from the serialized operator inputs on storage and the sink operator prints or logs out the execution stats.
Build a task with the assembled plan fragment in step 1. Apply the recorded query configuration and connector properties to replay the task with the same input and configuration setup as in production.
NOTE: The presto serialization might lose input vector encoding, such as lazy vector and nested dictionary encoding, which affects the operator’s execution. Hence, it might not always be the same as in production.
Tracing Framework
The tracing framework consists of three components:
Query Trace Writers: records the metadata, input data, and scan splits.
Query Trace Readers: load the metadata, read input data, and scan splits.
Query Trace Replayers: display query summaries or replay the execution of the target operator.
Trace Writers
There are three types of writers: TaskTraceMetadataWriter, OperatorTraceInputWriter, and OperatorTraceSplitWriter. They are used in the prod or shadow environment to record the real execution data.
TaskTraceMetadataWriter
The TaskTraceMetadataWriter records the query metadata during task creation, serializes it, and saves it into a file in JSON format. There are two types of metadata:
Query Configurations and Connector Properties: These are user-specified per query and can be serialized as JSON map objects (key-value pairs).
Task Plan Fragment (aka Plan Node Tree): This can be serialized as a JSON object, a feature already supported in Velox (see #4614, #4301, and #4398).
The metadata is saved as a single JSON object string in the metadata file. It would look similar to the following simplified, pretty-printed JSON string (with some content removed for brevity):
{
  "planNode":{
    "nullAware": false,
    "outputType":{...},
    "leftKeys":[...],
    "rightKeys":[...],
    "joinType":"INNER",
    "sources":[
      {
        "outputType":{...},
        "tableHandle":{...},
        "assignments":[...],
        "id":"0",
        "name":"TableScanNode"
      },
      {
        "outputType":{...},
        "tableHandle":{...},
        "assignments":[...],
        "id":"1",
        "name":"TableScanNode"
      }
    ],
    "id":"2",
    "name":"HashJoinNode"
  },
  "connectorProperties":{...},
  "queryConfig":{"query_trace_node_id":"2", ...}
}
OperatorTraceInputWriter
The OperatorTraceInputWriter records the input vectors from the target operator, it uses a Presto serializer to serialize each vector batch and flush immediately to ensure that replay is possible even if a crash occurs during execution.
It is created during the target operator’s initialization and writes data in the Operator::addInput method during execution. It finishes when the target operator is closed. However, it can finish early if the recorded data size exceeds the limit specified by the user.
OperatorTraceSplitWriter
The OperatorTraceSplitWriter captures the input splits from the target TableScan operator. It serializes each split and immediately flushes it to ensure that replay is possible even if a crash occurs during execution.
Each split is serialized as follows:
| length : uint32_t | split : JSON string | crc32 : uint32_t |
Storage Location
It is recommended to store traced data in a remote storage system to ensure its preservation and accessibility even if the computation clusters are reconfigured or encounter issues. This also helps prevent nodes in the cluster from failing due to local disk exhaustion.
Users should start by creating a root directory. Writers will then create subdirectories within this root directory to organize the traced data. A well-designed directory structure will keep the data organized and accessible for replay and analysis.
Metadata Location
The TaskTraceMetadataWriter is set up during the task creation so it creates a trace directory named $rootDir/$queryId/$taskId.
Input Data and Split Location
The task generates Drivers and Operators, and each is identified by a set of IDs. Each driver is assigned a pipeline ID and a driver ID. Pipeline IDs are sequential numbers starting from zero, and driver IDs are also sequential numbers starting from zero but are scoped to a specific pipeline, ensuring uniqueness within that pipeline. Additionally, each operator within a driver is assigned a sequential operator ID, starting from zero and unique within the driver.
The node ID consolidates the tracing for the same tracing plan node. The pipeline ID isolates the tracing data between operators created from the same plan node (e.g., HashProbe and HashBuild from the HashJoinNode). The driver ID isolates the tracing data of peer operators in the same pipeline from different drivers.
Correspondingly, to ensure the organized and isolated tracing data storage, the OperatorTraceInputWriter and OpeartorTraceSplitWriter are set up during the operator initialization and create a data or split tracing directory in $rootDir/$queryId$taskId/$nodeId/$pipelineId/$driverId.
The following is a typical HashJoinNode traced metadata and data storage directory structure:
trace ---------------------------------------------------> rootDir
└── query-1 -------------------------------------------> query ID
    └── task-1 ----------------------------------------> task ID
        ├── 2 -----------------------------------------> node ID
        │   ├── 0 -------------------------> pipeline ID (probe)
        │   │   ├── 0  -------------------------> driver ID (0)
        │   │   │   ├── op_input_trace.data
        │   │   │   └── op_trace_summary.json
        │   │   └── 1  -------------------------> driver ID (1)
        │   │       ├── op_input_trace.data
        │   │       └── op_trace_summary.json
        │   └── 1  -------------------------> pipeline ID (build)
        │       ├── 0 ---------------------------> driver ID (0)
        │       │   ├── op_input_trace.data
        │       │   └── op_trace_summary.json
        │       └── 1  -------------------------> driver ID (1)
        │           ├── op_input_trace.data
        │           └── op_trace_summary.json
        └── task_trace_meta.json  ----------------> query metadata
Memory Management
Add a new leaf system pool named tracePool for tracing memory usage, and expose it like memory::MemoryManager::getInstance()->tracePool().
Query Trace Readers
Three types of readers correspond to the query trace writers: TaskTraceMetadataReader, OperatorTraceInputReader, and OperatorTraceSplitReader. The replayers typically use them in the local environment, which will be described in detail in the Query Trace Replayer section.
TaskTraceMetadataReader
The TaskTraceMetadataReader can load the query metadata JSON file and extract the query configurations, connector properties, and a plan fragment. The replayer uses these to build a replay task.
OperatorTraceInputReader
The OperatorTraceInputReader reads and deserializes the input vectors in a tracing data file. It is created and used by a QueryTraceScan operator which will be described in detail in the Query Trace Scan section.
OperatorTraceSplitReader
The OperatorTraceSplitReader reads and deserializes the input splits in tracing split info files, and produces a list of exec::Split for the query replay.
Trace Scan
As outlined in the How Tracing Works section, replaying a non-leaf operator requires a specialized source operator. This operator is responsible for reading data records during the tracing phase and integrating with Velox’s LocalPlanner with a customized plan node and operator translator.
TraceScanNode
We introduce a customized ‘TraceScanNode’ to replay a non-leaf operator. This node acts as the source node and creates a specialized scan operator, known as OperatorTraceScan with one per driver during the replay. The TraceScanNode contains the trace directory for the designated trace node, the pipeline ID associated with it, and a driver ID list passed during the replaying by users so that the OperatorTraceScan can locate the right trace input data or split directory.
OperatorTraceScan
As described in the Storage Location section, a plan node may be split into multiple pipelines, each pipeline can be divided into multiple operators. Each operator corresponds to a driver, which is a thread of execution. There may be multiple tracing data files for a single plan node, one file per driver.
To identify the correct input data file associated with a specific OperatorTraceScan operator, it leverages the trace node directory, pipeline ID, and driver ID list supplied by the TraceScanNode.
During the replay process, it uses its own driver ID as an index to extract the replay driver ID from the driver ID list in the TraceScanNode. Along with the trace node directory and pipeline ID from the TraceScanNode, it locates its corresponding input data file.
Correspondingly, an OperatorTraceScan operator uses a trace data file in $rootDir/$queryId/$taskId/$nodeId/$pipelineId/$dirverId to create an OperatorTraceReader. And OperatorTraceScan::getOutput method returns the vectors read by its OperatorTraceInputReader, which returns the vectors in the same sequence order as originally processed in the production execution. This ensures that the replaying maintains the same data flow as in the original production execution.
Query Trace Replayer
The query trace replayer is typically used in the local environment and works as follows:
Use TaskTraceMetadataReader to load traced query configurations, connector properties, and a plan fragment.
Extract the target plan node from the plan fragment using the specified plan node ID.
Use the target plan node in step 2 to create a replay plan node. Create a replay plan using exec::test::PlanBuilder.
- If the target plan node is a TableScanNode
Add the replay plan node to the replay plan as the source node.
Get all the traced splits using OperatorInputSplitReader.
Use the splits as inputs for task replaying.
For a non-leaf operator, add a QueryTraceScanNode as the source node to the replay plan and then add the replay plan node.
Use exec::test::AssertQueryBuilder to add the sink node, apply the query configurations (disable tracing), and connector properties, and execute the replay plan.
The OperatorReplayBase provides the core functionality required for replaying an operator. It handles the retrieval of metadata, creation of the replay plan, and execution of the plan. Concrete operator replayers, such as HashJoinReplayer and AggregationReplayer, extend this base class and override the createPlanNode method to create the specific plan node.
Query Trace Tool Usage
Enable tracing using configurations in https://facebookincubator.github.io/velox/configs.html#tracing. After the traced query finishes, its metadata and the input data for the target tasks and operators are all saved in the directory specified by query_trace_dir.
To get a glance at the traced task, we can execute the following command:
velox_query_replayer --root_dir /trace_root --task_id task-4 --summary
It would show something as the follows:
++++++Query trace summary++++++
Number of tasks: 1

++++++Query configs++++++
      query_trace_task_reg_exp: .*
      query_trace_node_id: 2
      query_trace_max_bytes: 107374182400
      query_trace_dir: /tmp/velox_test_aJqeFd/basic/traceRoot/
      query_trace_enabled: 1

++++++Connector configs++++++

++++++Task query plan++++++
-- HashJoin[2][INNER t0=u0] -> t0:BIGINT, t1:VARCHAR, t2:SMALLINT, t3:REAL, u0:BIGINT, u1:INTEGER, u2:SMALLINT, u3:VARCHAR
  -- TableScan[0][table: hive_table] -> t0:BIGINT, t1:VARCHAR, t2:SMALLINT, t3:REAL
  -- TableScan[1][table: hive_table] -> u0:BIGINT, u1:INTEGER, u2:SMALLINT, u3:VARCHAR

++++++Task Summaries++++++

++++++Task task-1++++++

++++++Pipeline 2++++++
driver 0: opType HashProbe, inputRows 70720, peakMemory 108.00KB
driver 1: opType HashProbe, inputRows 70720, peakMemory 108.00KB

++++++Pipeline 3++++++
driver 0: opType HashBuild, inputRows 48000, peakMemory 4.51MB
driver 1: opType HashBuild, inputRows 48000, peakMemory 2.25MB
Then we can re-execute the query using the following command in the terminal or use the same flags in your IDE to debug.
velox_query_replayer --root_dir /Users/bytedance/work/native/trace --query_id query-1 --task_id task-1 --node_id 2
Stats of replaying operator HashBuild : Output: 0 rows (0B, 0 batches), Cpu time: 48.63us, Wall time: 65.22us, Blocked wall time: 24.08ms, Peak memory: 4.51MB, Memory allocations: 16, Threads: 2, CPU breakdown: B/I/O/F (23.79us/0ns/14.46us/10.38us)

Stats of replaying operator HashProbe : Output: 13578240 rows (1.17GB, 13280 batches), Cpu time: 3.99s, Wall time: 4.01s, Blocked wall time: 98.58ms, Peak memory: 108.00KB, Memory allocations: 12534, Threads: 2, CPU breakdown: B/I/O/F (8.52ms/1.59s/2.39s/20.29us)

Memory usage: TaskCursorQuery_0 usage 0B reserved 0B peak 10.00MB
    task.test_cursor_1 usage 0B reserved 0B peak 10.00MB
        node.2 usage 0B reserved 0B peak 0B
            op.2.1.1.OperatorTraceScan usage 0B reserved 0B peak 0B
            op.2.1.0.OperatorTraceScan usage 0B reserved 0B peak 0B
        node.N/A usage 0B reserved 0B peak 0B
            op.N/A.0.1.CallbackSink usage 0B reserved 0B peak 0B
            op.N/A.0.0.CallbackSink usage 0B reserved 0B peak 0B
        node.1 usage 0B reserved 0B peak 10.00MB
            op.1.1.0.HashBuild usage 0B reserved 0B peak 4.51MB
            op.1.0.1.HashProbe usage 0B reserved 0B peak 108.00KB
            op.1.1.1.HashBuild usage 0B reserved 0B peak 2.25MB
            op.1.0.0.HashProbe usage 0B reserved 0B peak 108.00KB
        node.0 usage 0B reserved 0B peak 0B
            op.0.0.1.OperatorTraceScan usage 0B reserved 0B peak 0B
            op.0.0.0.OperatorTraceScan usage 0B reserved 0B peak 0B
Here is a full list of supported command line arguments.
--root_dir: The root directory where the replayer is reading the traced data, must be set.--summary: Show the summary of the tracing including number of tasks and task ids. It also print the query metadata including query configs, connectors properties, and query plan in JSON format.--query_id: Specify the target query ID, it must be set.--task_id: Specify the target task ID, it must be set.--node_id: Specify the target node ID, it must be set.--driver_ids: Specify the target driver IDs to replay.--shuffle_serialization_format: Specify the shuffle serialization format.--table_writer_output_dir: Specify the output directory of TableWriter.--hiveConnectorExecutorHwMultiplier: Hardware multiplier for hive connector.--driver_cpu_executor_hw_multiplier: Hardware multipler for driver cpu executor.--memory_arbitrator_type: Specify the memory arbitrator type.--query_memory_capacity_mb: Specify the query memory capacity limit in MB. If it is zero, then there is no limit.--copy_results: If true, copy the replaying result.