
TL;DR:
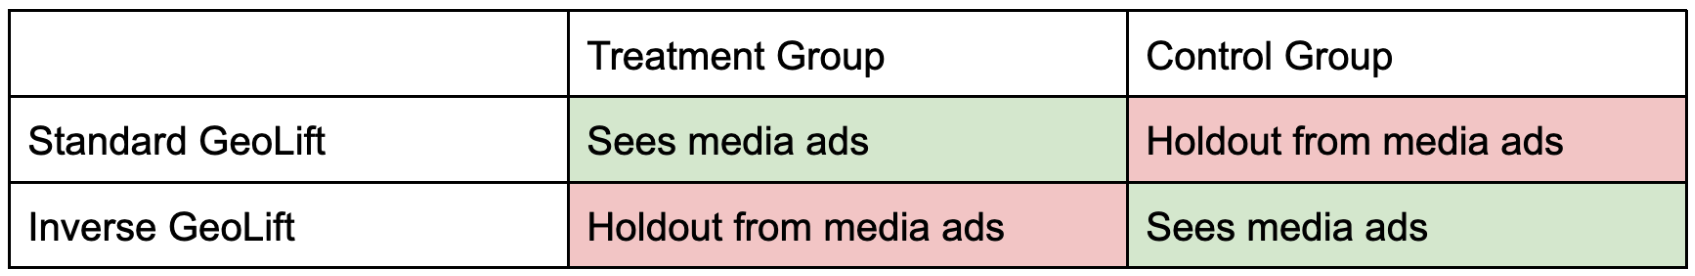
- Inverse GeoLifts help advertisers reduce geo experiment holdout sizes by inverting who sees ads: they show ads to the control group and do not show ads to the treatment group.
- Given that geo-experiments require large control groups, Inverse GeoLifts are a good way of reducing holdout groups and opportunity cost without losing testing accuracy.
- While Standard GeoLifts are great tools to measure a new media activity, ongoing media is best tested with an Inverse GeoLift.
- MMM calibration: Standard GeoLifts are straightforward inputs into MMMs, while Inverse GeoLifts have a larger complexity for this use case.
Introduction and motivation
GeoLift is an end-to-end solution that empowers you to determine the real effect of media via geographical experiments.
- It’s causal. GeoLift follows the KPI of a treatment group and compares it to what would have happened to that treatment group, if they had not been treated. This is what we call a counterfactual. The latter is built off of control locations that will not be exposed to the treatment effect and paired as close as possible to the treatment group, prior to the test.
- It’s transparent. Being an open source package hosted on Github, the code is freely available for everyone to use and inspect.
- It sets you up for success. There are many packages that help you analyze geographical quasi-experiments. There’s only one that runs power analysis via simulations to help the user define where the treatment should be applied, on top of the standard analysis module.
- It’s based on cutting-edge econometric models.
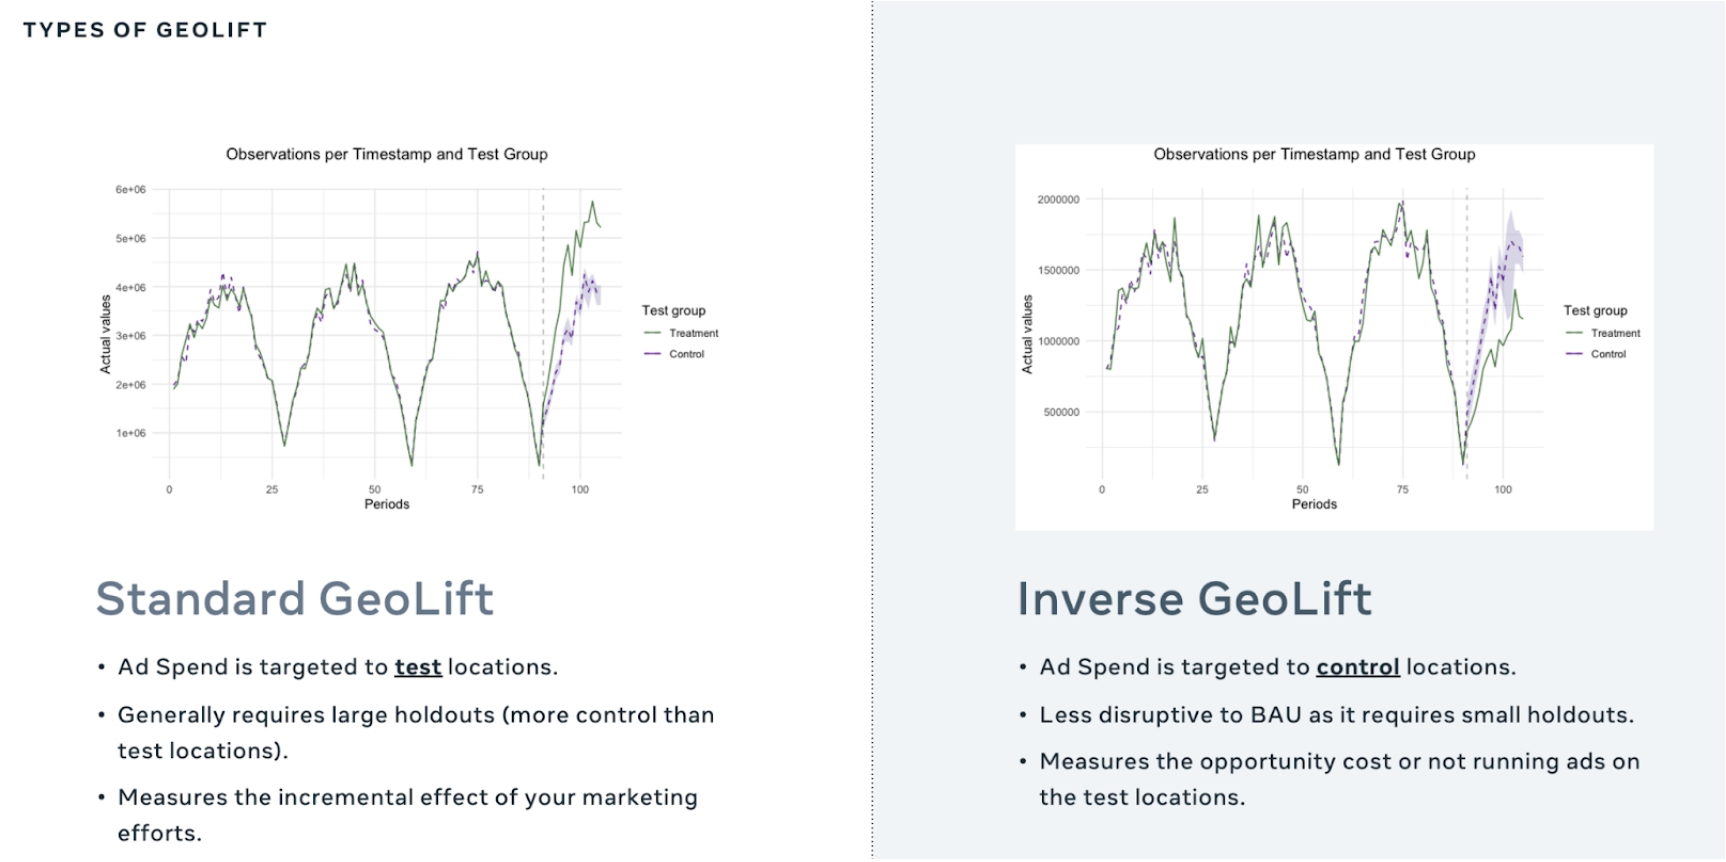
In order to construct a robust counterfactual, GeoLift usually requires more than half the amount of available locations to be part of the control group. This is because the counterfactual is created as a linear combination of the units in the pool of controls, therefore, richer pools tend to provide more robust counterfactuals. Standard GeoLifts can be a great setup when you are trying to measure the positive effect that new media has on your business.
However, it can be detrimental to run an experiment with a large holdout when you would like to measure ongoing media efforts. This has to do with the opportunity cost of running a test. When you are holding out media from certain locations, your total KPI will decrease by the effect that media has in those locations, scaled by the size of the holdout.

A new hope
A great way to reduce holdout size without compromising experiment accuracy is to flip GeoLift on its head: instead of showing media to the treatment group and holding out the control group, you holdout the treatment group and show media to the control group. This is what we refer to as an Inverse GeoLift.
Inverse GeoLifts have a different interpretation than Standard GeoLifts. Instead of measuring the contribution that media is having on the treatment locations, you are measuring the opportunity cost that holding out media has on the treatment locations.
The main assumption here is that positive and negative effects are interchangeable. In other words, if you would run a Standard or an Inverse GeoLift, the only thing that would change is the sign of the effect, not its absolute value. Don’t worry: when setting up a GeoLift and deciding which is the best treatment group for the experiment, the difference between the detected effect and the true effect is a variable that we are taking into account to rank different location combinations. Treatment setups that have a low difference are preferred and will be highly ranked. Check here to see what the ranking variables look like in our Walkthrough.
Tips for building and analyzing an Inverse GeoLift
Determine budget for the test.
As long as you know your Cost Per Incremental Conversion (CPIC), Standard GeoLifts will tell you the minimum budget that you should invest in the treatment group. For Inverse GeoLifts, we have to interpret the budget suggestion as the minimum amount of money that should be taken away from the treatment group. You can see these values in the Investment column from the output of GeoLiftMarketSelection.
If your treatment group is currently investing less than the required budget, then it will be hard to detect an effect, given that the CPIC is accurate. You should try to select treatment setups that have a current investment that is below the absolute value of the required budget. If there are no feasible options, we suggest increasing the budget for all markets within the control group to ensure that the minimum amount of investment in the treatment group is met. While this could change Business As Usual media circumstances, it becomes necessary in order to run a well-powered experiment. A good ad hoc rule for these cases is to compute the extra budget needed by calculating the difference between the required budget and the current investment in treatment and scaling that by the treatment investment share over total investment. This will give you the value that you need to put up to run a successful experiment.

Keep an eye on the weights for the counterfactual.
When setting up the test, you can access the weights for each of the control locations with the GetWeights() method. This will show you how each of the locations that will not be treated (shown media ads) will be weighted within the counterfactual.
When running an Inverse GeoLift, it’s important to guarantee that you will show media ads in these locations. If available, you can validate this by getting an investment report by location and ensuring that all locations with a positive weight in the counterfactual from GeoLift are being shown ads. If this condition is not met, we could be observing a very small treatment effect due to dilution of media within the control group, when the real treatment effect could be large.
Look for symmetric power curves
A symmetric power curve with respect to the y axis will guarantee that there are no considerable differences for a particular setup when changing from a Standard to an Inverse GeoLift. This is another guarantee that our assumptions for these types of tests hold. You can visualize this by running the GeoLiftPower() function with positive and negative effects, a larger lookback_window and plotting its output. You can check for examples of what it should look like in our Github Walkthrough.
Calculate the Treatment’s CPIC
At the end of your experiment, you will want to know how much each incremental action in the treatment group cost. Since you did not invest in the treatment, you need to estimate the budget in that group. In order to do so, you can calculate the sum of GeoLift weights from the counterfactual and multiply them by the investment per location in the control. Dividing it by the incremental conversions will give you the Cost Per Incremental Conversion.
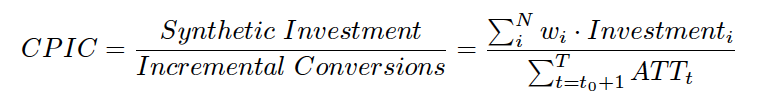
Where t0 represents the last pre-treatment time-stamp, T represents the treatment end, and N represents the number of units in the pool of controls.
What’s up next?
Stay tuned for our next blog posts, related to topics like:
- Calibrating your MMM model with GeoLift.
- What should my lookback window be?
- When should our GeoLift test start?
Want to try out your first Inverse GeoLift?
Install our Github package by following this link, or join our Facebook Group if you have further questions on our open source tool!