Common Data Errors in GeoLift
Introduction
GeoLift is an Open-Source solution developed by Meta Open Source that leverages the latest developments in Synthetic Control Methods (SCMs) to help businesses of all sizes measure the true value of their marketing efforts across channels and strategies. On top of it's market-leading technical capabilities to measure incrementality, one of GeoLift's biggest advantages is that it is simple and easy-to-use end-to-end solution. To run a GeoLift experiment you only need to have historical values of the KPI across time and goes. Specifically, we need the following data:
- Time: A time or date variable that reflects when things happened. We strongly recommend using daily data when available (if not, weekly data can be used).
- Location: A variable that denotes where things happened (our geos). The selection of the level of geographic level of granularity required for a GeoLift is a function of the available data as well as the targeting capabilities of each channel. For the most part, we recommend using DMAs, States, or Cities.
- KPI: The variable we want to measure the Lift on. This can be units sold, number of app downloads, referrals, or even sales.
- [Optional] Covariates: Variables with large predictive power over the KPI can be included in the analysis to improve the model-fit.
In this walkthrough we will review GeoLift's data requirements as well as some of the most commonly found data-related issues and how to solve them.
GeoLift Data Requirements
GeoLift can use any data-frame as long as it includes at the very least a time, location, and KPI variables. For most users, we recommend using the GeoDataRead() function to read their data frames into a format suited for the GeoLift functions. The help documentation of this function is a good starting point to learn more about GeoLift's data requirements.
# First we load GeoLift as well as other useful libraries
library(GeoLift)
library(dplyr)
library(tidyr)
library(lubridate)
# Read more about GeoDataRead's documentation
?GeoDataRead
We note that the input data set should:
- Have a
numericKPIvariable that indicates how much of this variable happened in each geo/date combination. - Include a
stringvariable that indicates the geography orlocationwhere each transaction occurred. - The time or date variable indicates when each transaction happened.
GeoDataRead()can use a wide variety of different daily, weekly, and monthly formats.
Finally, some important considerations for any GeoLift data set are:
- No
NAvalues in the KPI variable. Missing-value analysis/treatment should happen before we run the GeoLift test. - If a set of locations have a missing dates, they will be dropped from the final data frame. All locations should have the same number of rows.
- A location will only be taken into consideration if it has complete data (data for all time-periods).
Common Errors with GeoLift Data Sets
In this walkthrough we will be using the simulated dataset included in the GeoLift package. We can access it by executing:
data("GeoLift_PreTest")
head(GeoLift_PreTest)
## location Y date
## 1 new york 3300 2021-01-01
## 2 new york 3202 2021-01-02
## 3 new york 4138 2021-01-03
## 4 new york 3716 2021-01-04
## 5 new york 3270 2021-01-05
## 6 new york 3260 2021-01-06
This data frame contains the historical values of units sold for 40 locations across 90 days. This means that the data frame should contain 3600 rows and no missing values.
# Number of Rows in the data frame
nrow(GeoLift_PreTest)
## [1] 3600
# Number of NA values in our KPI variable
sum(is.na(GeoLift_PreTest$Y))
## [1] 0
We can use GeoDataRead() to read this data frame into GeoLift's format and proceed with running all of the other functions in the package!
GoodData <- GeoDataRead(data = GeoLift_PreTest,
                         date_id = "date",
                         location_id = "location",
                         Y_id = "Y",
                         X = c(), #empty list as we have no covariates
                         format = "yyyy-mm-dd")
Common Error 1: Missing Values
The most common type of issue with the input data is the pressence of missing values. We'll modify the simulated data frame to showcase this error, learn how to identify it, and fix it.
First, we will include missing values at "2021-03-01". In practice, these types of scenarios can happen due to system errors, store closures, data input issues, etc.
# Create a copy of our simulated data
Data_Error1 <- GeoLift_PreTest

# Introduce NAs at the specific date
Data_Error1$Y[Data_Error1$date == "2021-03-01"] <- NA

# check the data frame
head(Data_Error1[Data_Error1$date == "2021-03-01",])
 ## location Y date
## 60 new york NA 2021-03-01
## 150 chicago NA 2021-03-01
## 240 washington NA 2021-03-01
## 330 los angeles NA 2021-03-01
## 420 san francisco NA 2021-03-01
## 510 miami NA 2021-03-01
# Read it into GeoDataRead
GeoData_Error1 <- GeoDataRead(data = Data_Error1,
                               date_id = "date",
                               location_id = "location",
                               Y_id = "Y",
                               X = c(), #empty list as we have no covariates
                               format = "yyyy-mm-dd")

# Check the GeoLift data
head(GeoData_Error1)
## [1] location time Y
## <0 rows> (or 0-length row.names)
We have an empty data-frame! We can use the summary parameter of GeoDataRead() to have a better understanding of what happened:
# Read it into GeoDataRead with summary
GeoData_Error1 <- GeoDataRead(data = Data_Error1,
                               date_id = "date",
                               location_id = "location",
                               Y_id = "Y",
                               X = c(), #empty list as we have no covariates
                               format = "yyyy-mm-dd",
                               summary = TRUE)
## ##################################
## ##### Summary #####
## ##################################
##
## * Raw Number of Locations: 40
## * Time Periods: 90
## * Final Number of Locations (Complete): 0
We can see that while the input data-set had all 40 locations and 90 time-periods, the missing values at "2021-03-01" caused GeoDataRead() to drop all locations that had incomplete time-series.
Solution to Missing Values
When dealing with missing values, it is extremely important to first understand the process that generated those NAs. Whether a missing value was there because it was missing at random or because it was part of a pattern matters a lot when deciding how to deal with them. In this case, which is common in practice, we found that stores were closed on "2021-03-01" and the data-capturing system replaced all zeros with NA values. With that in mind, we can simply replace those values with 0's.
# Replacing NAs with 0
Data_Error1$Y <- replace_na(Data_Error1$Y,0)

# Read the data
GeoData_Error1 <- GeoDataRead(data = Data_Error1,
                               date_id = "date",
                               location_id = "location",
                               Y_id = "Y",
                               X = c(), #empty list as we have no covariates
                               format = "yyyy-mm-dd",
                               summary = TRUE)
## ##################################
## ##### Summary #####
## ##################################
##
## * Raw Number of Locations: 40
## * Time Periods: 90
## * Final Number of Locations (Complete): 40
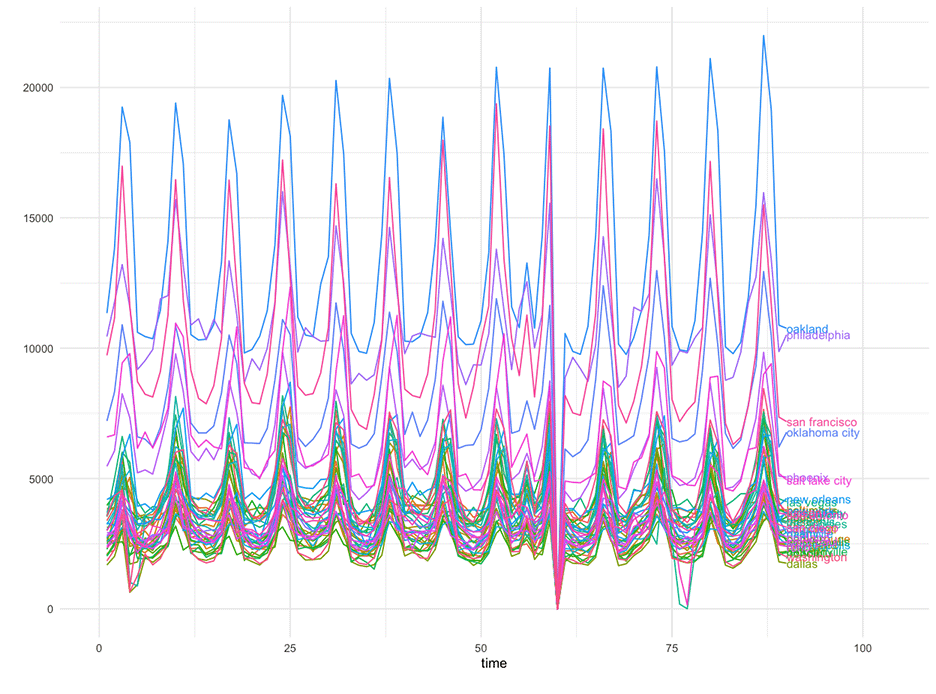
# Plot the data!
GeoPlot(GeoData_Error1)
Common Error 2: Missing Dates
Another common source of issues when reading data into the GeoLift format is that one or more locations have missing rows. This issue is commonly found when some locations didn't have sales on a given set of days and are filtered out from the data frame. As a consequence of having an incomplete time-series, these locations will be dropped by GeoDataRead().
# Create a copy of our simulated data
Data_Error2 <- GeoLift_PreTest

# Remove rows from NY, Washington, Denver, Oklahoma
Data_Error2 <- Data_Error2[-c(26, 215, 1205, 2060),]

# Read it into GeoDataRead
GeoData_Error2 <- GeoDataRead(data = Data_Error2,
                               date_id = "date",
                               location_id = "location",
                               Y_id = "Y",
                               X = c(), #empty list as we have no covariates
                               format = "yyyy-mm-dd",
                               summary = TRUE)
## ##################################
## ##### Summary #####
## ##################################
##
## * Raw Number of Locations: 40
## * Time Periods: 90
## * Final Number of Locations (Complete): 36
We can observer that as a consequence of having an incomplete time-series, these four locations were be dropped by GeoDataRead().
Solution to Missing Rows
As mentioned before, it is paramount to understand the reason behind the missing values or rows. Fortunately, in this example we know that the missing rows were dropped due to having no sales for a date/geo combination. Therefore, we can safely complete the data set by zero-filling the missing rows. The function complete from the package tidyr offers a convenient and efficient solution to complete the panel data.
# Create a copy of our simulated data
Data_Error2 <- Data_Error2 %>%
                tidyr::complete(date, location, fill = list(Y = 0))

GeoData_Error2 <- GeoDataRead(data = Data_Error2,
                               date_id = "date",
                               location_id = "location",
                               Y_id = "Y",
                               X = c(), #empty list as we have no covariates
                               format = "yyyy-mm-dd",
                               summary = TRUE)

# Plot the data!
GeoPlot(GeoData_Error2)
Common Error 3: Incompatible Date Format
A third type of frequently reported errors with GeoLift data sets are incompatible date formats. That is, date variables that aren't recognized by GeoDataRead(). The most common source of these issue is the use of different date formats across data sources.
# Create a copy of our simulated data
Data_Error3 <- GeoLift_PreTest

# Date in incompatible format dd/mm/yy
Data_Error3$date <- as.character(format(as.POSIXct(Data_Error3$date, format = "%Y-%m-%d"), "%d/%m/%y"))

# Data Frame's Structure
str(Data_Error3)
## 'data.frame': 3600 obs. of 3 variables:
## $ location: chr "new york" "new york" "new york" "new york" ...
## $ Y : int 3300 3202 4138 3716 3270 3260 3438 3427 3930 4939 ...
## $ date : chr "01/01/21" "02/01/21" "03/01/21" "04/01/21" ...
# Read it into GeoDataRead
GeoData_Error3 <- GeoDataRead(data = Data_Error3,
                               date_id = "date",
                               location_id = "location",
                               Y_id = "Y",
                               X = c(), #empty list as we have no covariates
                               format = "dd/mm/yy",
                               summary = TRUE)
## Error: Please enter a valid date format. Valid formats are:
## [1] "mm/dd/yyyy" "mm-dd-yyyy" "mm.dd.yyyy" "mmddyyyy" "dd/mm/yyyy"
## [6] "dd-mm-yyyy" "dd.mm.yyyy" "ddmmyyyy" "yyyy/mm/dd" "yyyy-mm-dd"
## [11] "yyyy.mm.dd" "yyyymmdd" "ww/yyyy" "ww-yyyy" "ww.yyyy"
## [16] "wwyyyy" "yyyy/ww" "yyyy-ww" "yyyy.ww" "yyyyww"
## [21] "mm/yyyy" "mm-yyyy" "mm.yyyy" "mmyyyy" "yyyy/mm"
## [26] "yyyy-mm" "yyyy.mm" "yyyymm"
Solution to Incompatible Dates
The easiest way to deal with incompatible dates is to first read the date variable as an R date object, and then changing the format to a compatible one. We recommend leveraging the as.POSIXct and as.POSIXlt functions as well as the lubridate package to handle these transformations. For instance:
# Read the date as an R date variable
Data_Error3$date <- as.POSIXct(Data_Error3$date, format = "%d/%m/%y")

# Change the format
Data_Error3$date <- format(Data_Error3$date, "%d/%m/%Y")

# Data Frame's Structure
str(Data_Error3)
## 'data.frame': 3600 obs. of 3 variables:
## $ location: chr "new york" "new york" "new york" "new york" ...
## $ Y : int 3300 3202 4138 3716 3270 3260 3438 3427 3930 4939 ...
## $ date : chr "01/01/2021" "02/01/2021" "03/01/2021" "04/01/2021" ...
# Read it into GeoDataRead
GeoData_Error3 <- GeoDataRead(data = Data_Error3,
                               date_id = "date",
                               location_id = "location",
                               Y_id = "Y",
                               X = c(), #empty list as we have no covariates
                               format = "dd/mm/yyyy",
                               summary = TRUE)
## ##################################
## ##### Summary #####
## ##################################
##
## * Raw Number of Locations: 40
## * Time Periods: 90
## * Final Number of Locations (Complete): 40
Final Remarks
We have reviewed the three most common sources of issues in GeoLift data-sets, which are caused by: missing values, missing rows, and incompatible data formats. If you run into any issues, bugs, or errors with the code, please reach out to the GeoLift Facebook Group (https://www.facebook.com/groups/fbgeolift) or official GeoLift GitHub Repository (https://github.com/facebookincubator/GeoLift) and open a new issue.